
SAKE, THROUGH TIME AND PLACE · PROCESS ENGINEERING
Why is sake difficult to make consistently? The challenge is to coordinate rice dissolution, enzymatic sugar production and yeast consumption while the raw material and biological activity keep changing—and while preserving the intended flavour.
By Kindness & Honesty · Literature reviewed: 22 October 2026 · English edition: 24 October 2026
Research status: This article is a literature review and proposed brewery research programme. It does not report experiments, performance improvements or a deployed control system completed by our team.
Abstract · The production system · Rice · Koji · The central difficulty · Engineering model · Research priorities · Brewery study · References
Abstract
The engineering difficulty of sake production arises from the interaction of a structured solid feedstock, enzyme reactions, living-cell metabolism and sensory quality. The susceptibility of steamed rice to enzymatic attack is not determined by rice variety or polishing ratio alone. The enzyme composition of koji depends on the organism and its temperature and moisture history. In moromi, the main fermentation mash, rice dissolution, saccharification, yeast growth and ethanol production proceed together. A measured glucose concentration is the net result of formation and consumption, not a direct measurement of the saccharification rate. Similar readings can therefore represent different internal states and require different responses.
From a chemical-engineering perspective, the central challenge is maintaining the coordination of dissolution, sugar supply and yeast uptake under changing feedstock properties and biological activity, with limited visibility of the relevant states and with product quality as a constraint. Koji making is a major upstream difficulty; coupling and diagnosis in moromi are the proposed first research focus. This prioritisation reflects engineering tractability and our process-engineering background, rather than a claim that one operation is the hardest for every brewery and style.
For a collaborative study with access to brewery batch records and samples, we propose beginning with one brewery and one regular product. Standardised rice-digestibility tests, calibrated process measurements and batch-level validation would support a diagnostic method that distinguishes restricted sugar supply from reduced yeast uptake capacity. The first deliverables would be a testable model and decision evidence. Model predictive control and transfer to other breweries would follow only if the initial validation supports them.
Keywords: sake; multiple parallel fermentation; starch retrogradation; solid-state fermentation; soft sensors; material balances; parameter identifiability; batch variability; process analytical technology.
1. Scope and interpretation of the evidence
This problem-oriented review uses 20 journal, technical-report and official-method sources spanning 1986–2026. The main sources are J-STAGE, the National Research Institute of Brewing (NRIB), Japan’s National Tax Agency, regional industrial research institutes and journal publishers. It is a narrative review, not an exhaustive systematic review or a meta-analysis. Each reference records whether the full text, selected methods and results, an abstract or an access-limited record was reviewed.
Three kinds of statement are distinguished throughout: literature evidence, meaning observations supported by a source; engineering inference, meaning analysis based on balances and reaction or transport engineering; and research proposals, meaning hypotheses, designs and provisional acceptance criteria still to be tested. Historical models, recent rice research and control studies of other beverages cannot be combined into an already validated universal sake model.
Multiphase dynamic modelling and temperature control of sake were already studied experimentally in 1986. NRIB also provides an established entry point for process-management data and control rules. Novelty must therefore be demonstrated through comparisons and independent data; it should not be asserted as the first use of modelling or AI in sake production. [R08] [R17]
2. Sake as an interconnected production system
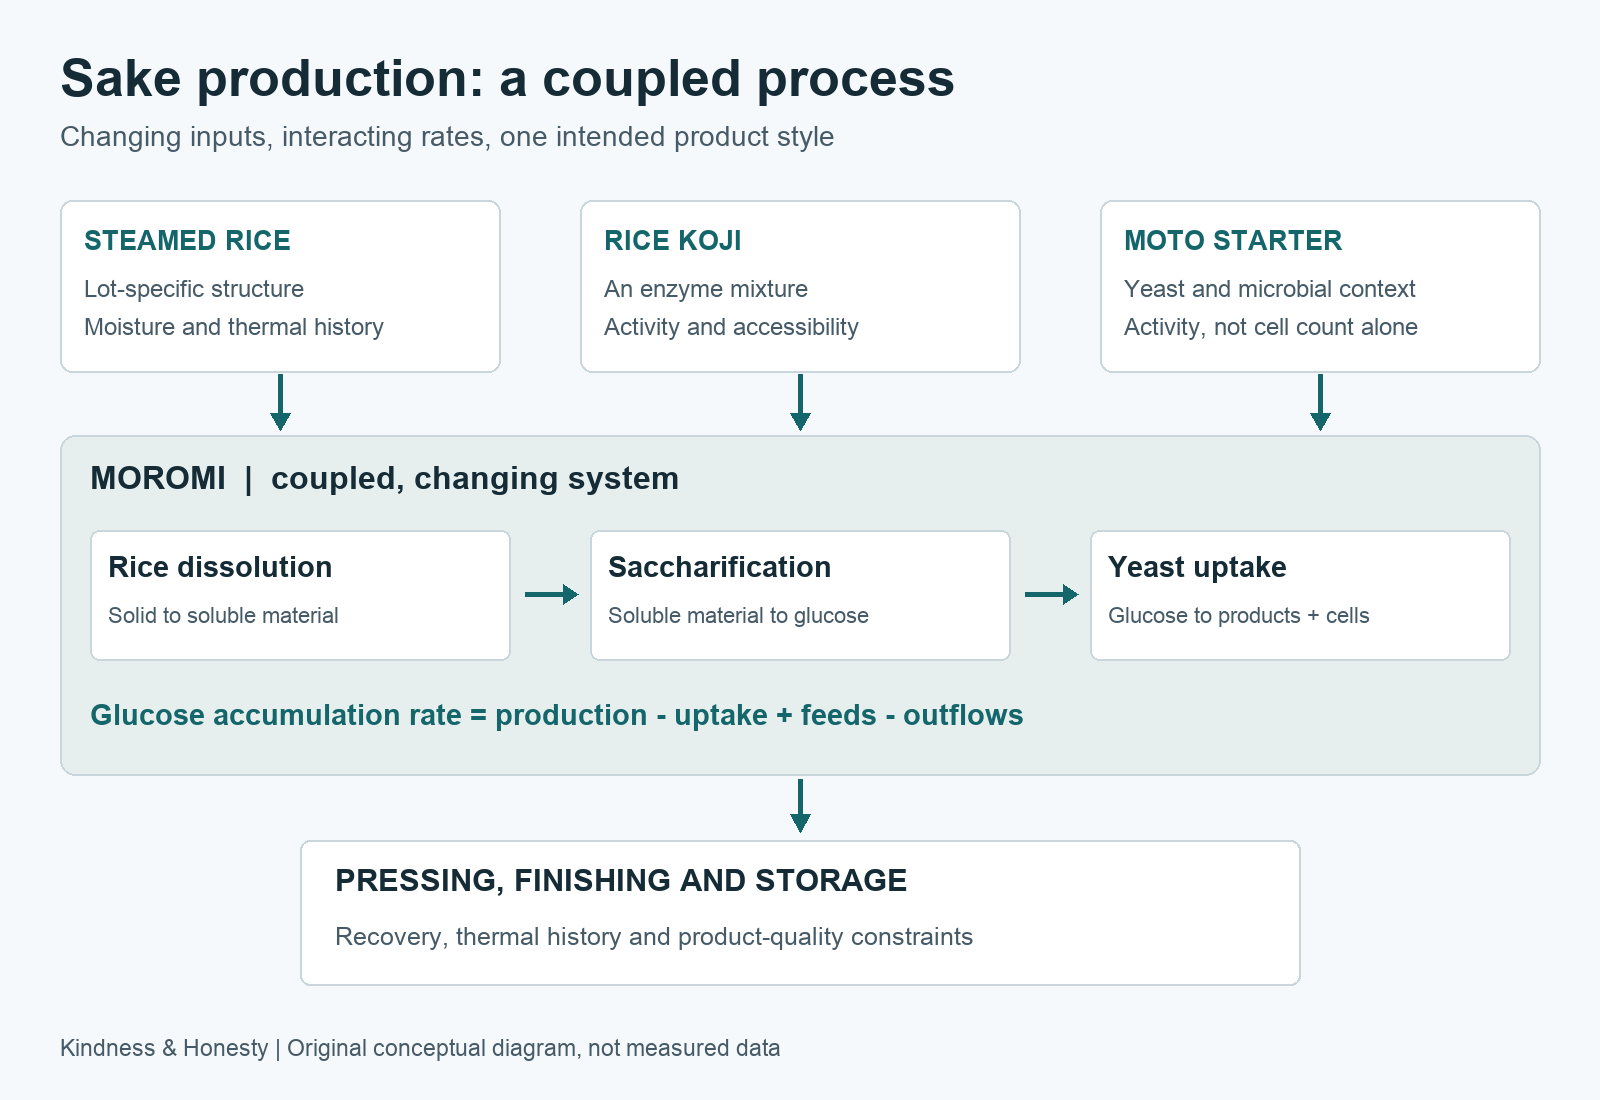
In the basic production sequence, rice supplies starch; koji making produces hydrolytic enzymes; the starter, or moto, establishes yeast and an appropriate fermentation environment; and saccharification and alcoholic fermentation proceed together in moromi. Pressing is followed by the filtration, adjustment, pasteurisation, storage and bottling steps appropriate to the product. This is a process framework: starter methods, dilution, heat treatment and ageing can differ between products. [R15]
| Operation | The engineering question | A misleading single proxy | A more useful research output |
|---|---|---|---|
| Polishing, soaking and steaming | Particle structure, water distribution, gelatinisation and subsequent retrogradation | Polishing ratio alone | A batch-specific raw-material and digestibility profile |
| Koji making | Growth, oxygen and moisture transport, metabolic heat and enzyme composition in a porous solid | Peak temperature or surface whiteness | An enzyme-activity profile and spatial uniformity |
| Starter preparation | Establishing active yeast, an acid environment and microbial competition | pH or cell count alone | Physiological activity and readiness for fermentation |
| Moromi | Coupled dissolution, sugar production, uptake and heat generation | Glucose, Baumé or visible bubbling alone | A diagnosis of the limiting mechanism and a next-day state estimate |
| Pressing and filtration | Solid–liquid separation, a compressible cake and recovery–quality trade-offs | Liquid recovery alone | A joint assessment of recovery, sake lees and quality |
| Pasteurisation and storage | Enzyme inactivation, microbial control, thermal uniformity and downstream contamination | The heater setpoint alone | Actual thermal history and storage quality |
Engineering inference: Maximising conversion independently in every operation may accelerate fermentation without delivering the acidity, aroma or mouthfeel intended for the product. Define the product first, then the process objectives.
3. First difficulty: apparently similar rice is not a fixed reaction substrate
3.1. Gelatinisation, retrogradation and enzyme accessibility
A rice grain is not a homogeneous starch powder. Hydration, steaming, porosity and the protein matrix affect access to reaction sites. Starch retrogradation during cooling changes digestibility again. In a study of 136 Japanese rice samples, Okuda and colleagues linked digestibility to starch structure, differential scanning calorimetry (DSC) and Rapid Visco Analyser (RVA) measurements, and observed that ethanol could accelerate amylopectin retrogradation under sake-making conditions. The relationship between rice preparation and later ethanol formation is therefore not simply one-way. [R02]
Research on rice grown during the hot 2010 grain-filling season showed changes in gelatinisation and digestibility, with variation even among samples from the same prefecture. A 2026 study of 24 rice samples examined Alk/Wx genetic backgrounds, starch structure and digestibility under brewing conditions. Together these studies support measuring actual raw-material lots; they do not justify assigning a fixed fermentation profile from a prefecture name. [R03] [R04]
3.2. Why adding more enzyme may not solve the problem
If access inside the grain is limiting, a higher enzyme concentration in the liquid need not produce a proportional rise in dissolution. Earlier work also described unavailable adsorption of α-amylase to rice proteins and a mechanism by which acid protease could improve its action. Insufficient enzyme, ineffective adsorption and inaccessible substrate are different hypotheses requiring different measurements. [R01]
A 2023 experiment on mizu-koji and steamed-rice dehydration found different responses in glucose, maltose and Baumé. It used a particular rice sample and small-scale brewing with destructive sampling. The practical lesson is to measure sugar composition and define the sampling basis, rather than treating a drying time from one experiment as a universal instruction. [R07]
Research question: Can a small set of pre-mash rice measurements explain differences in sugar supply between batches of the same product? If those measurements do not improve prediction on independent batches, their current practical value should be rejected rather than concealed by a more complicated model.
4. Second difficulty: koji making is a solid-state bioreactor problem
In engineering terms, koji making involves a heat-generating, oxygen-consuming solid-state biological system with evolving moisture distribution and pore structure. Room relative humidity is not rice moisture content, and moisture content is not water activity. A single temperature probe cannot describe spatial differences across a bed. These distinctions matter when designing measurements.
Ventilation affects oxygen supply, cooling and drying simultaneously. Increasing airflow to remove heat can also alter surface moisture and fungal development. A bed-average temperature may conceal local hot spots. Bed depth, turning, loading and gas paths affect transport conditions, so moving from a small tray to a production bed cannot be based on proportional rice mass alone. These are transport-engineering inferences; their magnitude must be measured in the target brewery.
Tsujii analysed 41 daiginjo koji samples from 39 producers. Some moisture relationships were not significant in multiple regression, and certain correlation analyses excluded extreme drying cases. The study illustrates how strain, duration and moisture are intertwined in brewery records. A single correlation line is not sufficient evidence of an operating cause. [R05]
Mycelial penetration, or haze-komi, can provide useful information, but its relationship to different enzymes is not interchangeable. Matsunaga and colleagues supported the importance of α-amylase under their experimental conditions. Images can document morphology; they cannot directly replace analyses of glucoamylase, α-amylase and proteolytic activities. [R06]
4.1. Measurements for a koji study
Record temperature histories at central and peripheral positions, moisture at defined stages, turning and airflow events, and enzyme activities on a dry-mass or explicitly moisture-corrected basis. An activity unit must carry its assay substrate, pH, temperature and reaction time. U/g measured in a standard assay is not automatically an in-mash rate constant at low fermentation temperature.
Later research topic: Investigate whether spatial transport measurements help reduce bed differences and excessive drying while achieving the intended enzyme profile. The first programme should not attempt both a complete koji model and closed-loop moromi control. Initially, use the measured koji enzyme profile as an input to the mash model.
5. Third difficulty: living cells and microbial environments do not have fixed performance curves
The starter establishes an appropriate fermentation capacity. Sokujo, kimoto and yamahai differ in how this environment develops; a single initial-pH variable cannot remove every difference. Kimoto studies have observed microbial succession, and a 2024 study found differences across four starter lots and two brewing years in a newly established brewery. These observations support recording starter type and brewing environment, not assuming that every traditional starter follows an identical microbial sequence. [R11] [R12]
Yeast cell count, viability and actual sugar-uptake capacity are also distinct. Watanabe and colleagues linked a RIM15 loss-of-function mutation to high fermentation rates and altered stress responses in the strains studied. This cannot be reduced to a rule that faster-fermenting strains tolerate every stress better. [R10] Later in a fermentation, ethanol, nutrients, temperature history and physiological state may jointly affect performance.
Initial study boundary: Focus on an established regular product, starter method and yeast familiar to the collaborating brewery. If the evidence indicates that starter ecology or contamination dominates the deviations, involve a microbiology partner and revise the research focus instead of forcing every deviation into a saccharification explanation.
6. The central difficulty: production and consumption are coupled, but measurements show their net effect
In conventional moromi, koji primarily supplies enzymes formed upstream. The model should not assume that the koji organism continues producing all enzymes through the same aerobic growth process used during koji making. Dissolution, glucose formation and yeast uptake have different kinetics and temperature responses. Raising temperature can change several rates and also alter metabolism and aroma; slow fermentation does not, by itself, establish that warming is the correct response. [R01] [R15]
Glucose accumulation rate = saccharification rate − yeast uptake rate + feed input − sampling and other outflows
A low glucose reading may indicate weak sugar supply or rapid consumption. Accumulating sugar with a falling CO₂ signal calls for checking uptake capacity, sampling and measurement conditions. The challenge is not merely measuring glucose: it is distinguishing different internal causes from the information actually available.
| Observed combination | Competing hypotheses | Useful discriminating checks | Appropriate first-study response |
|---|---|---|---|
| Low glucose, low CO₂ | Poor rice accessibility; insufficient enzyme supply; normal late stage; sampling or measurement error | Residual hydrolysable starch, soluble oligosaccharides, enzyme records, cell activity and process stage | Trigger additional measurements and brewery review, not automatic warming |
| High glucose, low CO₂ | Yeast inhibition or reduced activity; nutrient limitation; faulty gas capture | Independent ethanol analysis, cell activity and counts, pH/acidity and gas-system condition | Separate a biological problem from an instrument problem |
| Low glucose, high CO₂ | Rapid uptake of newly formed sugar; a local sample that does not represent the tank | Glucose and ethanol changes over time, sampling position and material balances | Do not label low glucose as saccharification failure by default |
| Glucose and ethanol appear normal, but sensory quality differs | Metabolic side pathways, finishing or storage effects | Selected aroma compounds, organic acids, off-flavours and thermal/oxygen exposure | Stop treating the ethanol trajectory as a complete quality description |
This table proposes diagnostic hypotheses and measurement priorities. It is not a validated fault classifier. More than one cause may remain compatible with an observation; “not yet distinguishable” must be a legitimate output.
7. Flavour and finishing make a single yield objective inadequate
7.1. The same ethanol concentration does not mean the same quality
Quality includes sugar–acid balance, amino-acid-related taste, aroma and undesirable notes. Isoamyl acetate and ethyl hexanoate are frequently discussed ginjo-aroma compounds, but more of one compound does not automatically mean better sake. The National Tax Agency’s components page helps explain the measurements; its historical averages are not specifications for a particular brewery. [R20]
A 2025 study of high-ethyl-hexanoate yeasts reported aroma characteristics alongside fermentation behaviour in selected strains. It supports considering strain differences in a quality model, not assuming that temperature adjustment can reproduce another strain’s performance. [R14] For this programme, stabilising the process around an established strain is a more appropriate starting point than yeast breeding.
7.2. Pressing, pasteurisation and storage can become the limiting operations
Pressing involves solid–liquid separation and a compressible cake. Pressure, time and recovery need to be evaluated with chemical and sensory measurements of the recovered fractions. A well-fitted fermentation model does not establish that downstream quality is controlled.
Pasteurisation has separate enzyme-inactivation and microbial-control purposes. Tanimoto and colleagues showed that enzymes in fresh sake differ in thermal stability and that sugar and ethanol affect inactivation. Heater settings, actual product thermal history, enzyme inactivation and microbial lethality therefore require separate verification. Conditions effective in one enzyme experiment are not a universal product pasteurisation schedule. [R13]
Research-priority condition: If the brewery’s main losses occur during storage or after shipment, thermal history, dissolved oxygen and downstream quality tracking may deserve priority over moromi modelling. The site problem and available evidence should determine the sequence.
8. An engineering model must be identifiable, not merely elaborate
8.1. Establish the material basis first
Use mass states inside the tank in the first model, then convert to concentrations using measured or estimated liquid volume. Staged additions, dilution and sampling change mass and volume. A falling concentration does not necessarily mean that material was consumed. Wet sake-lees yield is likewise not a direct measure of unconverted starch.
(C₆H₁₀O₅)ₙ + n H₂O → n C₆H₁₂O₆
C₆H₁₂O₆ → 2 C₂H₅OH + 2 CO₂
Using approximate molecular masses of 162, 180, 46 and 44, complete hydrolysis and ideal alcoholic fermentation of 1 kg of pure starch would yield about 0.568 kg ethanol and 0.543 kg CO₂. The corresponding ethanol/CO₂ mass ratio is 92/88 ≈ 1.045. These are stoichiometric upper bounds, not sake yield per kilogram of rice. Real balances include biomass, glycerol and other products, residual sugars, sampling and evaporation. Alcohol by volume and mass fraction are not interchangeable.
8.2. A minimal candidate state model
Let mR be undissolved starch expressed as glucose equivalent, mD soluble oligosaccharides on the same basis, and mG glucose mass. All three use kg glucose equivalent. Let mE be ethanol in kg and X effective yeast quantity in kg dry-cell equivalent. Growth and loss coefficients μ and kd have units day⁻¹. Reaction rates below use kg glucose equivalent/day; each F or L has the units of its corresponding state per day.
dmR/dt = FR − rdis − LR
dmD/dt = FD + rdis − rsac − LD
dmG/dt = FG + rsac − ruptake − LG
dmE/dt = YE/G ruptake − LE
dX/dt = (μ − kd)X + FX − LX
F represents recorded inputs and L sampling or other losses. Converting cell counts to X requires calibration; total dry solids in moromi cannot stand in for yeast dry mass. YE/G is an effective actual yield, not a constant fixed at the theoretical maximum. A complete carbon balance needs corresponding coproduct and cell-synthesis measurements or states; ethanol yield should not absorb every modelling error. Dry solids, dry starch and glucose equivalent must remain distinct, including the 162-to-180 mass change on hydrolysis.
Model proposal: Let dissolution depend on a rice-accessibility measure, enzyme information and temperature; saccharification on soluble substrate, glucoamylase activity and temperature; and uptake on glucose, effective yeast quantity and selected inhibition terms. Do not freely fit every Monod, ethanol-inhibition, substrate-inhibition and deactivation parameter at once. Estimate only the complexity supported by the data.
8.3. Energy balances and spatial assumptions
dH/dt = Σṁinhin − Σṁouthout + Qmet − UA(T − Tc) − Qevap
Total enthalpy H retains the effects of feed additions and changing mass. The mash contains solids, bubbles and potentially temperature gradients. Treat it as one uniform state only if multipoint measurements support that assumption. If gradients exceed measurement uncertainty and the tolerance relevant to decisions, compare a two-zone model before commissioning a full three-dimensional CFD study.
8.4. Identifiability is an acceptance condition
Temperature, density and CO₂ alone will generally not identify every internal rate uniquely. If several parameter combinations fit the same trajectories, one fitted combination cannot be presented as an established biological mechanism. Use sensitivity analysis, parameter profiles and whole-batch resampling to examine uncertainty. Merge parameters or add measurements of glucose, oligosaccharides and residual starch when needed.
A historical rise in fermentation rate after warming is not automatically a causal estimate of warming. The brewer may have observed an incompletely recorded condition before intervening. Record the reason for each decision, then use appropriate comparisons or controlled small-scale studies to address causality.
9. Reliable measurements come before soft sensors
9.1. CO₂ concentration is not CO₂ generation rate
A local probe concentration, a ventilation-diluted signal and a whole-tank exhaust molar flow are different quantities. A gas balance requires known flow, compatible temperature and pressure measurements and a consistent wet or dry basis. It must also consider headspace and dissolved-CO₂ accumulation, condensation and leakage. Integrating ppm or counting bubbles does not establish a whole-tank fermentation carbon balance.
rCO₂,gen = ṅoutyCO₂,out − ṅinyCO₂,in
+ d(Ngas + Ndissolved)/dt
An Ibaraki starter study did report a strong relationship between a local CO₂ measurement and independent ethanol analyses. Its device sampled a particular region and used a specific starter procedure. The reported correlation coefficient of 0.99 is not a cross-batch prediction error or external validation in a large moromi tank. [R09] Its measurement concept is useful precedent; its fitted coefficients should not simply be transferred.
For an open tank, use a measurement approach compatible with its ventilation and hygiene requirements rather than closing it merely to collect gas. Where whole-tank CO₂ cannot be measured reliably, investigate a calibrated local signal or mass change with feed, sampling and evaporation records. Either route needs independent validation.
9.2. Density, Baumé and refractive index do not separately measure sugar and ethanol
Sugar and ethanol affect density in different directions, while gas, temperature and solids also affect readings. Clarified-liquid and whole-mash measurements are not interchangeable. Use the National Tax Agency’s analytical methods as a reference entry point, with the laboratory confirming applicability and calibration. Record filtration, degassing, measurement temperature and delay for every reference sample. [R16]
Continuous sensing increases time resolution, not the number of independent batches. One ethanol reference result per day does not establish minute-by-minute ground truth. Retain missing data, sensor maintenance and calibration events.
9.3. Sequence the measurement investment
Establish comparable reference analyses before judging low-cost proxy signals. If daily sampling and a simple balance answer the decision question, an expensive spectroscopic or metabolomics installation need not come first. Beer research on CO₂/density estimation and predictive control is a useful methodological comparison, but it lacks the same rice-dissolution process and cannot directly validate a sake model. [R18]
10. A research programme matched to chemical-engineering strengths
Proposed principal topic: Identifiable State Estimation and Batch-Deviation Diagnosis for Sake Multiple Parallel Fermentation under Rice-Digestibility Variability.
This connects material balances, reaction engineering, process control and industrial data analysis to a practical brewery question. Aspen-type tools can support thermophysical and heat-balance work, but the core problem is not solved by selecting an equilibrium reactor. Start with a dynamic model whose equations and units can be inspected. Biological measurements, representative sampling and product judgement still require brewing and analytical collaborators.
| Work package | Question and hypothesis | Method | What would count against the hypothesis? |
|---|---|---|---|
| A. Rice and sugar supply Initial requirement | Do digestibility measurements and rice-processing history improve sugar-supply predictions within one product? | Lot profiles, standardised enzyme-digestion tests, outsourced DSC/RVA where justified; comparison with variety/polishing-only baselines | No improvement on independent batches, or measurement cost exceeds decision value |
| B. Limiting-state diagnosis Main initial output | Do glucose, residual hydrolysable starch and independent ethanol measurements reduce confusion between restricted supply and reduced yeast uptake? | A mass-state model, soft sensing, triggered samples, blinded expert assessment and batch-level holdouts | States remain indistinguishable, calibration is unstable, or false alarms rise without an actionable benefit |
| C. Quality-constrained advice Second stage | Can advice based on a validated diagnosis reduce deviations while maintaining product specifications? | Offline replay and shadow operation, followed only by brewery-approved controlled comparisons | Prediction improves but flavour, hygiene or operating burden deteriorates |
| D. Koji transport and composition Later sub-study | Do spatial measurements explain enzyme variation beyond average temperature? | Multipoint measurements, loading/airflow events, dry-basis enzyme analysis and spatial samples | No added explanatory value, or sampling itself disturbs koji production |
| E. Heat treatment and storage Rank by site losses | Does actual thermal history and oxygen exposure explain quality better than equipment setpoints? | Equipment measurements, appropriate enzyme/microbial validation and staged storage tests | The main cause is instead packaging, contamination or distribution conditions |
Select A and B for the first programme. Simultaneously pursuing koji modelling, breeding, microbiomes, comprehensive aroma profiling and closed-loop control would make a focused, testable conclusion harder to achieve. Re-rank C–E after the initial data review.
11. A practical collaborative brewery study
11.1. Define the comparison unit and product boundary
Select one stable regular product at one collaborating brewery. Confirm its starter method, usual yeast, rice lots and polishing conditions, tank types and existing analyses. Treat a tank batch as the main independent unit. Tanks sharing a starter or koji lot have a common source and need grouped statistical treatment. Record changes in materials and equipment rather than deleting inconvenient batches to improve the fit.
Ask the brewery to identify a recurring, costly decision problem: a mid-to-late fermentation deviation, variable recovery, repeated additional analyses or uncertain pressing timing. Establish whether it occurs in the historical records and how the present practice performs. Do not promise a yield increase or shorter cycle before this baseline exists.
11.2. Historical records and prospective observation
Planning scale: Begin with approximately 12–20 comparable historical batches for feasibility and model exploration, then reserve 8–12 previously unseen future batches for a prospective pilot. These are workload estimates, not a statistical power calculation. Rare deviations, correlated batches or strong seasonal variation may require more data. Claims across years or breweries require separate validation.
| Data layer | Initial minimum | Proposed timing | Bias to avoid |
|---|---|---|---|
| Materials and recipe | Rice lots, polishing ratio, moisture, separate koji/non-koji rice charges, water and starter/yeast sources | Each batch; timestamp every addition | Mixing wet and dry bases or recording only total rice |
| Rice preparation and koji | Soaking, steaming and cooling history; moisture before charging; koji lot and available enzyme assays | Each relevant material or koji lot | Combining U/g from incompatible methods |
| Tank and operations | Product temperature, cooling settings, water, mixing/kai-ire, samples, deviations and reasons for interventions | Temperature about every 1–5 minutes; actual event timestamps | Keeping only shift averages or using post-intervention information to predict the past |
| Reference analyses | Glucose, ethanol, density or Baumé, pH and acidity; targeted solids/residual starch | Generally daily; around 12-hourly in selected windows if practical | Claiming validation on a shorter time scale than the reference sampling supports |
| Cell state | Selected yeast counts, viability/activity assessments and microbiology where necessary | Establishment, middle, transition, late stage and triggered events | Equating staining, colony counts and uptake capacity |
| Final quality | Ethanol, sugar, acids, selected aromas, lees/liquid mass, specifications and blinded sensory results | Pressing fractions or endpoint; additional storage points for downstream questions | Replacing a defined quality objective with one aroma value or an unstructured tasting opinion |
First test sample representativeness with replicate samples from the same tank: height, mixing condition, solids fraction, filtration/degassing and delay before analysis all matter. Account for sample removal in the balance. Repeated analyses of one bottle are analytical replicates, not independent fermentation batches.
11.3. An initial 18-treatment-unit digestion comparison
Start with a rice-enzyme digestion comparison without yeast: three actual rice lots × three independent steaming preparations per lot = nine preparations. Split each preparation between two cooling/holding conditions, giving 18 treatment units. The treatment comparison has nine pairs or an equivalent split-plot structure; it is not 18 independent steaming experiments. Allow enough subsamples for each planned analysis time.
Fix the analytical enzyme source and traceable activity basis. Measure glucose, soluble sugars and residual starch while recording moisture, dry-basis input and thermal history. Set the actual cooling/holding conditions jointly with the brewery and laboratory, using the current operating window. A contrast such as zero versus 24 hours would be a research condition for retrogradation, not a recommendation to hold production rice for 24 hours. A small preliminary run should determine sampling points and variance before fixing the full design. Three rice lots support comparisons of those lots, not a population distribution for an entire region.
Removing yeast isolates the sugar-supply side. The experiment cannot, by itself, establish whole-tank moromi behaviour. If the rice comparison is informative, progress to small-scale verification within an established brewery or appropriately equipped research facility. Do not deliberately create failures in commercial batches.
11.4. Responsibilities
The chemical-engineering contribution covers mass and energy bases, calibration strategy, dynamic models and identifiability. The brewery defines product requirements, operating windows and past decisions. Analytical and microbiology partners verify enzyme, sugar, ethanol and cell measurements. Sensory work needs blinded samples and trained assessors. Literature records, data preparation and modelling can be developed alongside—not in place of—representative sampling and product judgement.
12. What would make the research convincing?
12.1. Compare meaningful baselines
B0 is the brewery’s current trajectories and expert practice. B1 is a simple statistical forecast using, for example, stage, temperature and the previous analytical result. B2 is a simplified mechanistic model without a rice profile. Candidate B3 adds digestibility information and selected measurements. Add inputs incrementally to identify whether any gain comes from new measurements, model structure or extra parameters.
A model that performs well only on development batches has not demonstrated generalisation. Split data by complete batches, shared-material groups and temporal order. Randomly splitting minute-level records from the same tank between training and testing leaks information across the boundary.
12.2. Metrics and decisions specified in advance
| Level | Metrics | Assessment |
|---|---|---|
| Measurement credibility | Reference repeatability, bias, delay and balance residuals | Set tolerances by uncertainty propagation; do not train a precise model on uncalibrated measurements |
| Prediction | Next-day ethanol/glucose mean absolute error (MAE), bias and prediction-interval coverage | Report batch results and whole-batch resampling; improvements over B1/B2 must matter to decisions |
| Diagnosis | Confusion matrices, missed events, false alarms per batch and useful warning time | Use additional measurements and expert review as reference evidence, not the model’s own label |
| Quality | Product specifications, selected aromas/off-flavours and trained blinded assessment | Define acceptable differences first; absence of significance does not prove sensory equivalence |
| Practical value | Analytical/operating work, extra samples, recovery/lees variation and use of recommendations | Measure whether useful benefits justify the added burden |
Provisional engineering targets for discussion: next-day ethanol MAE no greater than 0.3 ABV percentage points and glucose MAE no greater than 2 g/L. These are neither achieved results nor industry standards. Revise them if reference uncertainty, concentration range or the decision scale does not support them. Formal sample size should follow pilot variance and the cost of wrong decisions.
For sensory data, use agreed vocabulary and suitable reference materials, with blinding, balanced presentation order and repeat assessment. The number of assessor observations is not the number of brewing batches. A claim of non-inferior quality requires a predefined margin and suitable sample-size design; one tasting that seems similar is not that conclusion. [R19]
12.3. When to consider closed-loop control
Proceed to operating advice only when measurements are reliable, model states are identifiable, future-batch results are acceptable and diagnostic errors have tolerable consequences. Move from offline replay to shadow operation—predictions and advice without changing the existing operating practice—then to brewery-approved controlled comparisons. Temperature, rate-of-change and timing constraints must remain within the brewery’s approved window. Return to human judgement when inputs fail or model uncertainty rises.
13. A first 90-day programme and subsequent papers
This proposed schedule begins when brewery sampling arrangements and usable data are in place. Production timing and cross-year validation may exceed 90 days. If insufficient future batches are available, complete the data and modelling work without claiming demonstrated field effectiveness.
| Period | Work | Inspectible output and next-stage condition |
|---|---|---|
| Weeks 1–2 | Select the product/problem; audit 12–20 historical batches; define sampling and analyses; compare materials, tanks and event records | A study brief, data dictionary, sampling card and current-practice baseline; confirm that the data can address the question |
| Weeks 3–5 | Run reference-method/material pilots; begin prospective records; refine the 18-treatment-unit study and analytical workload | Repeatability, representative samples and preliminary lot comparisons; identify useful inputs |
| Weeks 6–8 | Compare B0–B3; check balances and uncertainty; use grouped and time-ordered holdouts | Equations, parameter provenance, failure cases, next-day forecasts and ablation comparisons; simplify or change the question if there is no gain |
| Weeks 9–12 | Shadow future batches; trigger confirmatory sampling and expert review; assess burden and remaining evidence gaps | A prospective pilot report and a clear useful/not-useful assessment; decide from evidence whether to test operating changes |
| Next brewing season | Validate against another material set, year or brewery | Until then, conclusions remain limited to the first brewery, product and observed conditions |
13.1. Possible papers, not predetermined results
Paper 1: Whether rice-digestibility measurements improve predictions of moromi sugar supply across material lots for one product. The contribution is repeatable analysis, lot effects and independent validation; a useful result could also show that simple indicators are insufficient.
Paper 2: Whether a mechanistic soft sensor with a small number of selected reference analyses distinguishes limiting states better than temperature/density/CO₂ alone. The focus is identifiability, measurement cost and failure cases.
Paper 3: If the preceding work supports it, investigate quality-constrained operating advice and cross-batch validation. Without a controlled or otherwise sufficiently credible comparison, do not claim a causal yield benefit.
13.2. Questions for the first brewery research meeting
- Which regular product and recurring deviation should be studied first?
- Which historical batches, material lots and operating timestamps can be linked to starter, koji and tank identities?
- Who performs current glucose, ethanol, enzyme and cell analyses, with what uncertainty and turnaround time?
- Can sampling be sustained with a consistent method and an acceptable workload?
- How will the brewery judge value, and which data may support a joint publication rather than remain internal?
Borrow or outsource DSC/RVA and selected chemical analyses before assuming a full spectroscopy or metabolomics purchase. Budget from actual batch counts, sampling points, analytical items and laboratory quotations, then refine the scale after the pilot.
14. Conclusion
The difficulty of sake production cannot be reduced to one ideal temperature. It is a multiphase biological process in which substrate structure, effective enzyme action and cell performance change, while quality demands a particular product style. Koji making must establish the right growth, transport conditions and enzyme profile. Moromi must coordinate sugar supply and yeast demand—and reveal the source of deviations despite limited measurements.
For a chemical-engineering team working with a brewery, a defensible starting point is rice digestibility, conservation-constrained models and a small number of discriminating measurements. Establish explanation and prediction before intervention. This uses process-engineering strengths while bringing the brewer’s observations, decisions and counterexamples into a research record that can be checked.
References and extent of review
Each record states the evidence used and its limits. Journal issue years are retained where they differ from online-release dates. The technical report retains its fiscal-year designation. Sources were checked on 22 October 2026; this English edition was prepared on 24 October 2026.
R01 · Technical review
Nunokawa, Y.. 1986. Enzymes Participating in Sake Fermentation. Journal of the Japanese Society of Starch Science 33(2), 95–103. DOI: 10.5458/jag1972.33.95
Extent of review: Publisher abstract and selected original passages; text extraction from the scanned paper is incomplete.
Evidence used: Separates rice dissolution, glucose formation and yeast ethanol formation; discusses unavailable adsorption and acid-protease effects.
Limit: Historical constants, enzyme units and substrate conditions cannot be transferred directly to another brewery.
R02 · Original research
Okuda, M. et al.. 2009. Influence of Starch Characteristics on Digestibility of Steamed Rice Grains under Sake-making Conditions, and Rapid Estimation Methods of Digestibility by Physical Analysis. Journal of Applied Glycoscience 56(3), 185–192. DOI: 10.5458/jag.56.185
Extent of review: Publisher abstract and methodological outline.
Evidence used: Relates starch properties and digestibility in 136 rice samples; reports ethanol-related retrogradation and evaluates DSC/RVA measures.
Limit: Correlations and a defined digestion test are not a complete causal prediction of any production mash.
R03 · Original research
Okuda, M. et al.. 2013. Starch characteristics and enzyme digestibility of steamed rice grains grown at high air temperature during grain filling in 2010. Journal of the Brewing Society of Japan 108(5), 368–376. DOI: 10.6013/jbrewsocjapan.108.368
Extent of review: Publisher abstract.
Evidence used: Examines gelatinisation and digestibility of rice from a hot grain-filling year, including variation within prefectures.
Limit: A prefecture or year label is not a substitute for analysing actual material lots.
R04 · Original research
Lee, L.-J.; Sato, Y.; Joyo, M.; Takahashi, K.; Okuda, M.. 2026. Rice Genotype Related to Starch Biosynthesis: Effects on Rice Starch Structure and Enzymatic Digestibility during Shochu and Sake Production. Journal of Applied Glycoscience 73(3), 7303101. DOI: 10.5458/jag.7303101
Extent of review: Open HTML full text, with particular attention to the abstract, methods and results.
Evidence used: Studies Alk/Wx background, starch structure and brewing digestibility across 24 rice samples.
Limit: Includes different shochu and sake conditions. Rankings for a genotype or shochu test are not universal sake operating rules.
R05 · Journal survey analysis
Tsujii, M.. 2023. Factors Affecting Enzyme Activities and Mycelial Content in Koji for Daiginjo Making. Journal of the Brewing Society of Japan 118(7), 456–464. DOI: 10.6013/jbrewsocjapan.118.456
Extent of review: PDF methods, tables, results and discussion; the figure/table on page 460 was also visually checked.
Evidence used: Analyses 41 daiginjo koji samples from 39 producers, with interrelated moisture, duration and strain factors.
Limit: Not a randomised intervention. Some analyses excluded extreme drying samples; univariate correlation is not causality.
R06 · Original research
Matsunaga, K.; Furukawa, K.; Hara, S.. 2002. Effects of enzyme activity on the mycelial penetration of rice koji. Journal of the Brewing Society of Japan 97(10), 721–726. DOI: 10.6013/jbrewsocjapan1988.97.721
Extent of review: Publisher abstract.
Evidence used: The strain and gene-introduction experiments support a role of alpha-amylase in mycelial penetration under the tested conditions.
Limit: Visible coverage cannot replace individual enzyme assays; photographs alone do not establish fermentation capacity.
R07 · Original research
Yamazaki, E. et al.. 2023. Changes in sugar concentrations during the sake moromi process by mizu-koji and/or dehydration of steamed rice. Journal of the Brewing Society of Japan 118(12), 874–880. DOI: 10.6013/jbrewsocjapan.118.874
Extent of review: PDF experimental methods and selected results; the methods on page 875 were visually checked.
Evidence used: Mizu-koji and steamed-rice dehydration affect sugar composition, enzyme extraction and early moromi behaviour differently.
Limit: Uses specific materials, yeast and small vessels. Sampling was destructive; it was not unlimited repeated sampling from one vessel.
R08 · Original research
Sugimoto, Y. et al.. 1986. Adaptive control strategies for the mashing process in Saké brewing. Journal of Fermentation Technology 64(3), 187–197. DOI: 10.1016/0385-6380(86)90098-1
Extent of review: Publisher-indexed abstract; the full text was access-restricted and was not read in full.
Evidence used: Provides prior work on solid–liquid dynamic modelling and experimental-scale temperature control of sake.
Limit: The abstract does not establish that all equations, data or experimental details have been obtained or reproduced.
R09 · Official technical research report
石川卓、河原航、野口友嗣、飛田啓輔. Fiscal year 2023. 二酸化炭素発生量からのアルコール濃度推定による日本酒発酵工程のスマート化 [Making sake fermentation smarter by estimating alcohol concentration from carbon dioxide generation]. Reports of the Ibaraki Industrial Technology Innovation Center, No. 52, fiscal year 2023.
Extent of review: Complete two-page PDF and its figures; checked against the official project page updated on 20 January 2025. The report uses a fiscal-year designation.
Evidence used: Links a local CO2 measurement to starter ethanol analyses; reports a correlation coefficient of 0.99 under its conditions.
Limit: A specific starter, local probe and calibration: not whole-tank exhaust flow or proof of accuracy across brewery moromi batches.
R10 · Original research
Watanabe, D. et al.. 2012. A Loss-of-Function Mutation in the PAS Kinase Rim15p Is Related to Defective Quiescence Entry and High Fermentation Rates of Saccharomyces cerevisiae Sake Yeast Strains. Applied and Environmental Microbiology 78(11), 4008–4016. DOI: 10.1128/AEM.00165-12
Extent of review: Public abstract; access to the full article page was unstable during preparation.
Evidence used: Associates RIM15 loss of function with high fermentation rates and altered stress responses in the sake strains studied.
Limit: Does not cover every sake strain or show increased tolerance to every stress.
R11 · Original research
Bokulich, N. A.; Ohta, M.; Lee, M.; Mills, D. A.. 2014. Indigenous Bacteria and Fungi Drive Traditional Kimoto Sake Fermentations. Applied and Environmental Microbiology 80(17), 5522–5529. DOI: 10.1128/AEM.00663-14
Extent of review: PubMed abstract and indexed public full-text passages; the full-text page was not consistently accessible.
Evidence used: Uses sequencing and related methods to observe traditional kimoto microbial succession and environmental sources.
Limit: Limited brewery and sampling coverage; not evidence that every kimoto follows an identical microbial sequence.
R12 · Original research
Yamane, M. et al.. 2024. Lot-to-lot variation in the microbiota during the brewing process of kimoto-type Japanese rice wine. Bioscience of Microbiota, Food and Health 43(3), 250–259. DOI: 10.12938/bmfh.2023-092
Extent of review: Publisher abstract and study-design overview.
Evidence used: Examines microbial differences among four starter lots over two brewing years at a newly established brewery.
Limit: Four lots at one new brewery do not establish an industry-wide microbiome model.
R13 · Original research
Tanimoto, S. et al.. 2004. Thermal inactivation behavior of enzymes in fresh sake during pasturization. Journal of the Brewing Society of Japan 99(3), 208–214. DOI: 10.6013/jbrewsocjapan1988.99.208
Extent of review: Publisher abstract.
Evidence used: Shows that enzyme type, sugar and ethanol affect thermal-inactivation kinetics.
Limit: Enzyme inactivation is not microbial lethality; its heating conditions are not a universal pasteurisation process.
R14 · Original research
田﨑裕二 et al.. 2025. カプロン酸エチルを高生産する清酒酵母の育種と清酒醸造特性 [Breeding sake yeast for high ethyl hexanoate production and its sake-brewing characteristics]. Japanese Journal of Mycology 66(2), 47–58. DOI: 10.18962/jjom.jjom.R6-1
Extent of review: Publisher abstract.
Evidence used: Reports aroma and fermentation trade-offs in selected strains, with FAS2 variation implicated in their aroma characteristics.
Limit: A strain-specific result cannot be reproduced arbitrarily through temperature changes; yeast engineering is not proposed for the first programme.
R15 · Official technical introduction
Japan Sake and Shochu Makers Association. Undated. How is Sake Made?. Official process introduction.
Extent of review: Public webpage.
Evidence used: Explains the basic roles of rice, koji and yeast and simultaneous saccharification/fermentation.
Limit: High-level guidance, not a source of universal kinetic constants, flavour causality or optimal operating conditions.
R16 · Official analytical-method entry point
國稅廳. Undated. 國稅廳所定分析法(訓令) [National Tax Agency prescribed analytical methods]. Official analytical-method index.
Extent of review: Method index checked; individual analytical procedures were not reproduced in this review.
Evidence used: Provides an entry point for reference methods for alcohol, density, acidity and related analyses.
Limit: Before use, confirm the current procedure, applicable matrix, equipment and laboratory calibration.
R17 · Official research resource
酒類總合研究所 NRIB. Undated. 清酒製造支援データベースについて [About the sake production support database]. Official process-management resource.
Extent of review: Official introduction and development report; the database homepage had redirection problems during preparation.
Evidence used: An established source of process data, reaction-rate relationships and control rules.
Limit: Raw datasets were not bulk-acquired; public browsing does not automatically establish unrestricted commercial reuse.
R18 · Original research in an adjacent field
2026. Cascade predictive control design for a beer fermenter — simulation and experimental assessment. Food and Bioproducts Processing 157, 252–264. DOI: 10.1016/j.fbp.2026.03.020
Extent of review: Publisher abstract and highlights; full text was access-restricted.
Evidence used: Beer research already addresses CO2/density estimation and cascade predictive control.
Limit: Wort fermentation does not replace a model of solid-rice dissolution and sugar supply in sake.
R19 · Official sensory-evaluation resource
酒類總合研究所 NRIB. 2006. 清酒の官能評価分析における香味に関する品質評価用語及び標準見本 [Quality-evaluation terms and reference standards for the sensory analysis of sake]. NRIB official sensory-evaluation resource.
Extent of review: Official index and text summary; reference-sample evaluation was not performed in this review.
Evidence used: Provides a basis for shared sensory vocabulary and reference materials.
Limit: A vocabulary standard does not replace blinding, assessor training or sensory statistics.
R20 · Official composition information
國稅廳. Undated. Components of Japanese Sake. Official composition guide; statistical period 2008–2012.
Extent of review: Public webpage and its stated statistical period.
Evidence used: Explains sake meter value, acidity, amino acid value and selected ginjo-aroma compounds.
Limit: Historical commercial averages are not current operating targets or product-release limits.


Leave a Reply